


By analyzing upto 30 years of historical data we detect patterns in prices for Stocks, Commodities, FOREX, and Options.
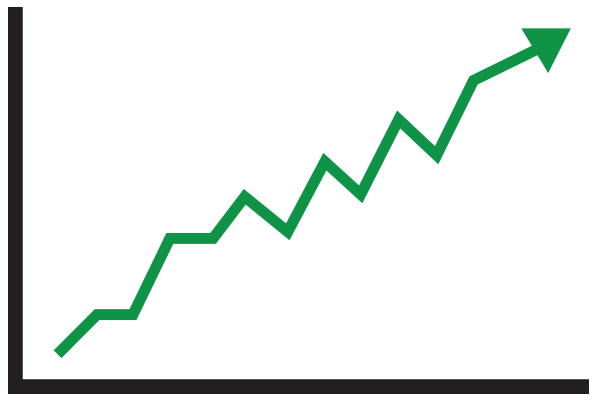
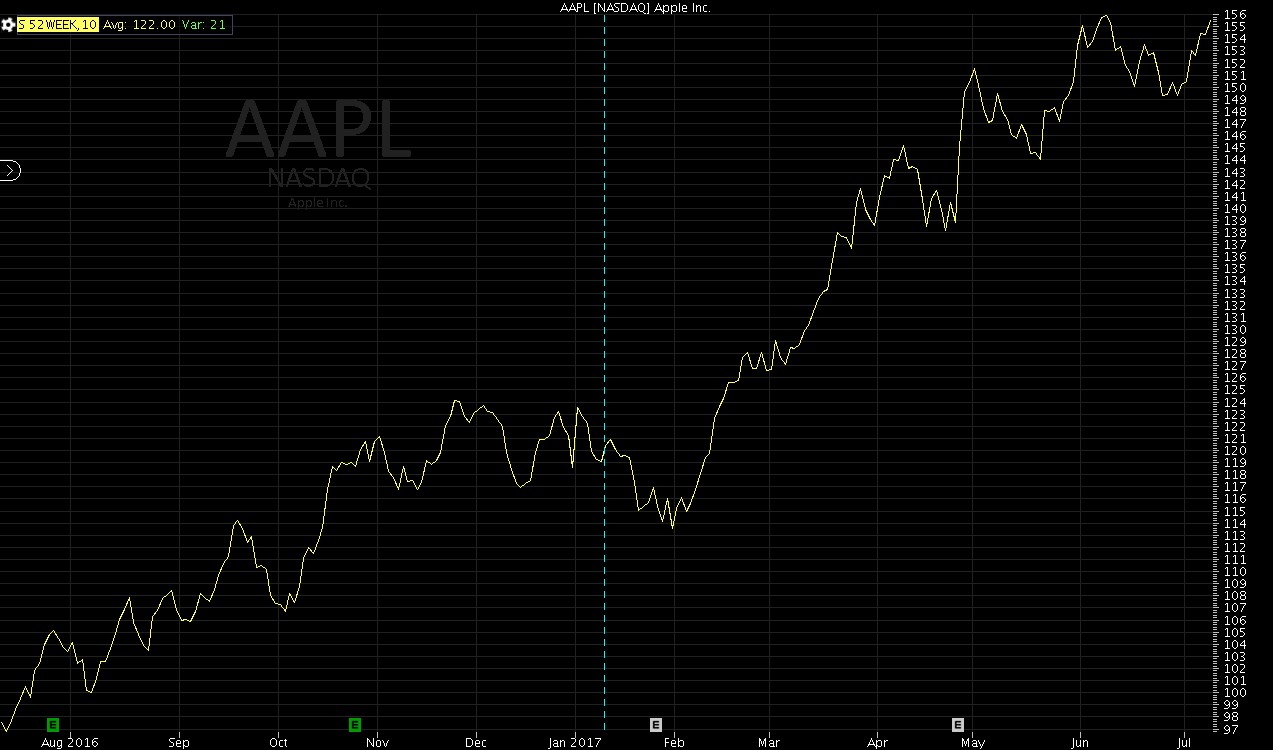
We display the pattern as a simple line chart showing what time of the year prices are at their highest and lowest.
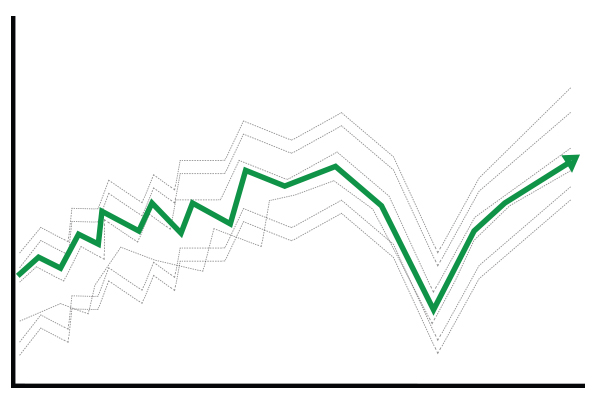
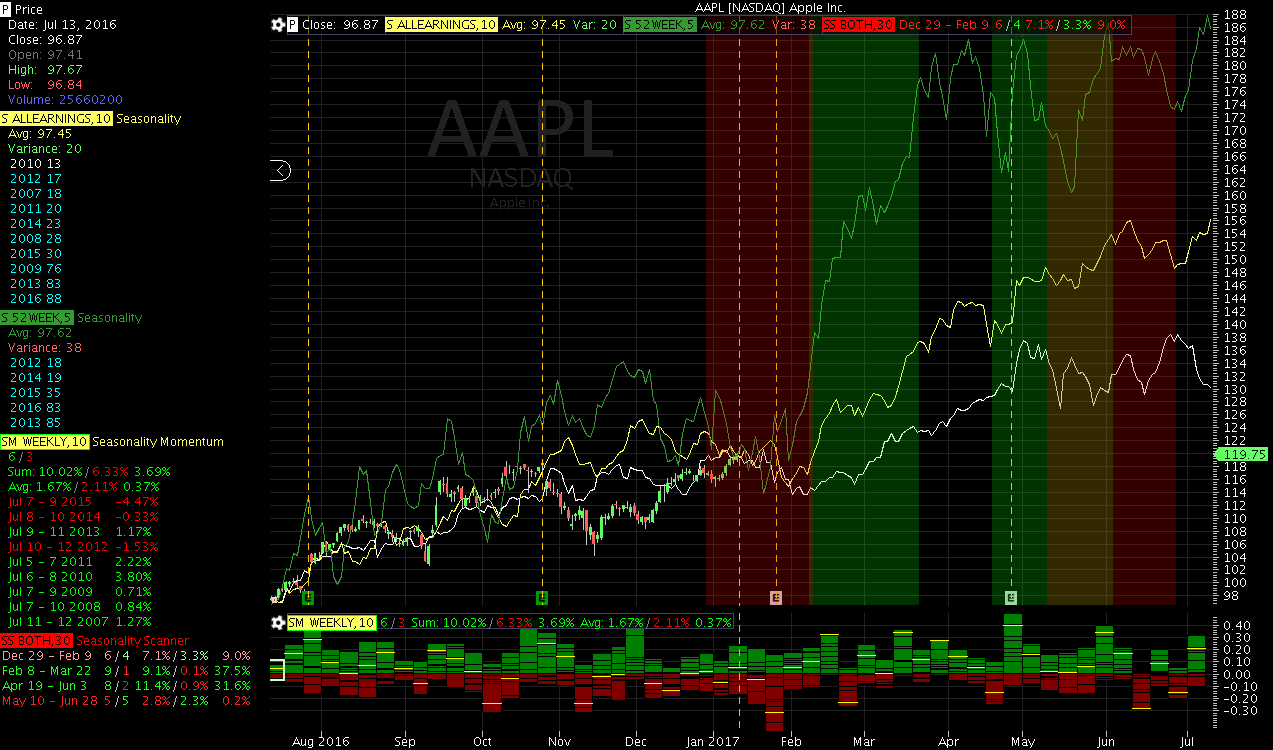
We put Seasonality in context with the current price and historical volatility, and centered the chart on the current day, to give you a perspective on expected price movement in the next 6 months.
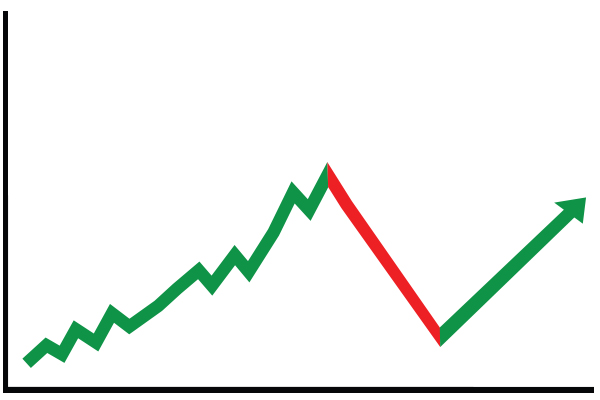
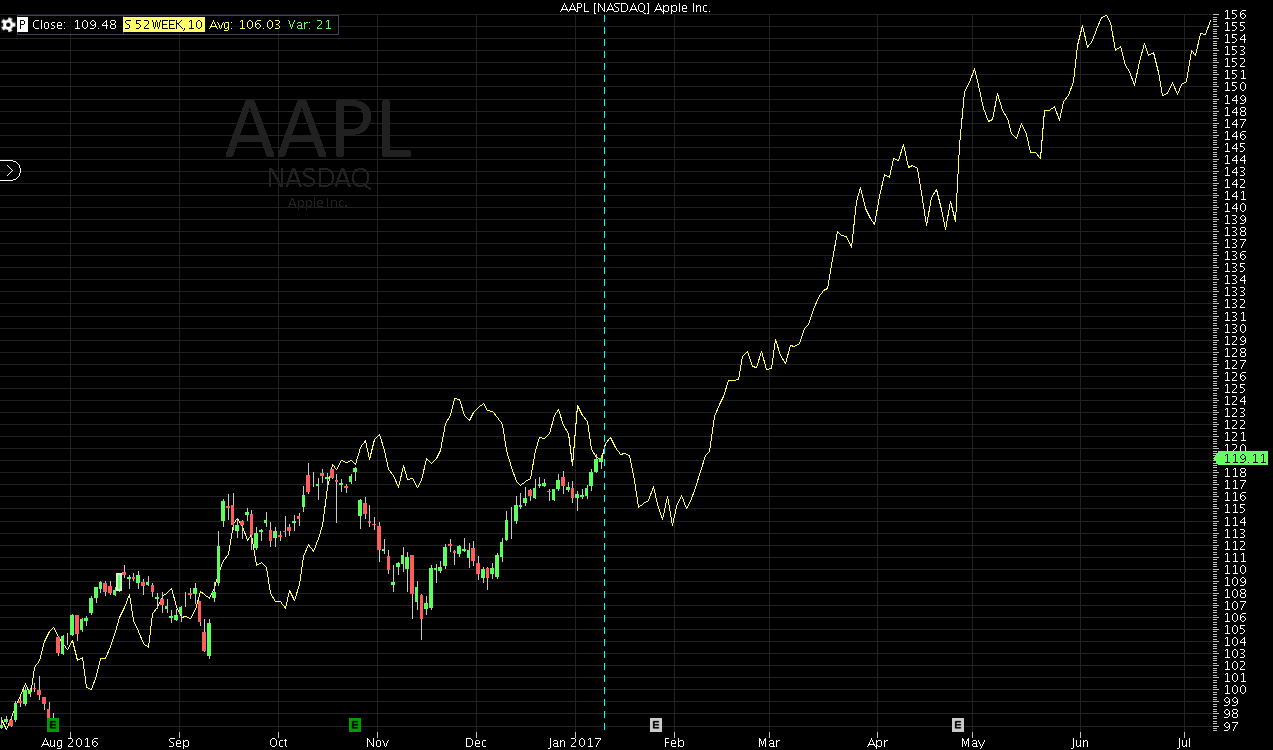
We also allow you to compare the last 6 months of price movement with that predicted by Seasonality.
We even quantified the difference and called it Seasonality Variance. The lower the variance the better Seasonality predicted price movements!
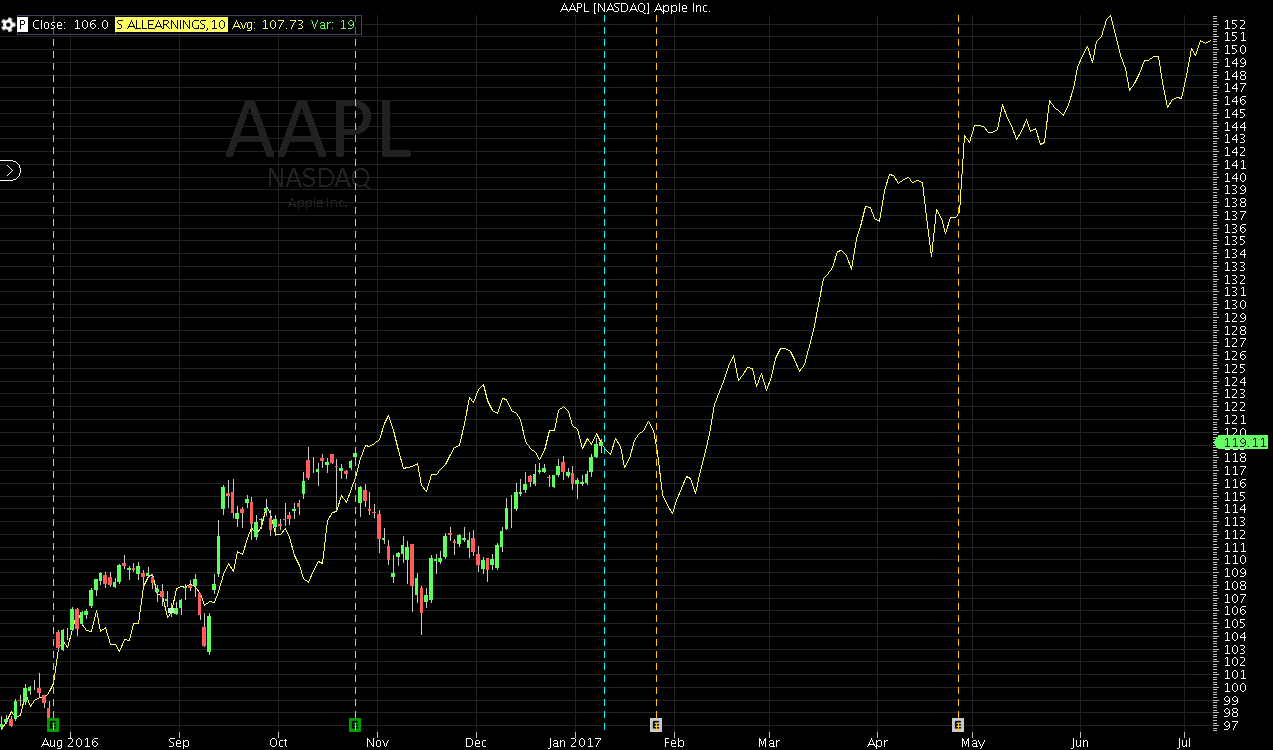
We calculate annual Seasonality on a calendar week or calendar day basis or constrained by the quarterly earnings schedules.
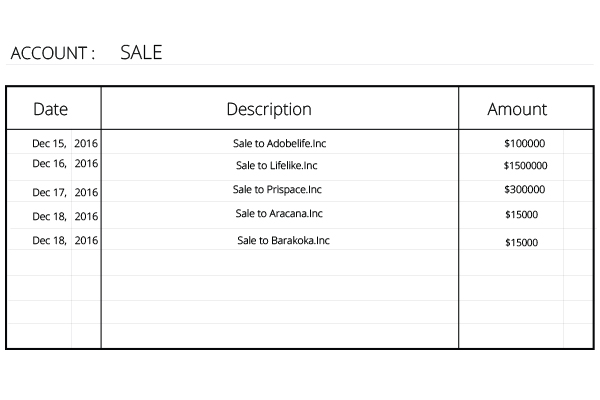
Annual Earnings Seasonality lines up all the earnings days for respective quarters going back up to 30 years.
The result is the best predictor of price movement in existence based on thousands of data points and by the way that companies really work.
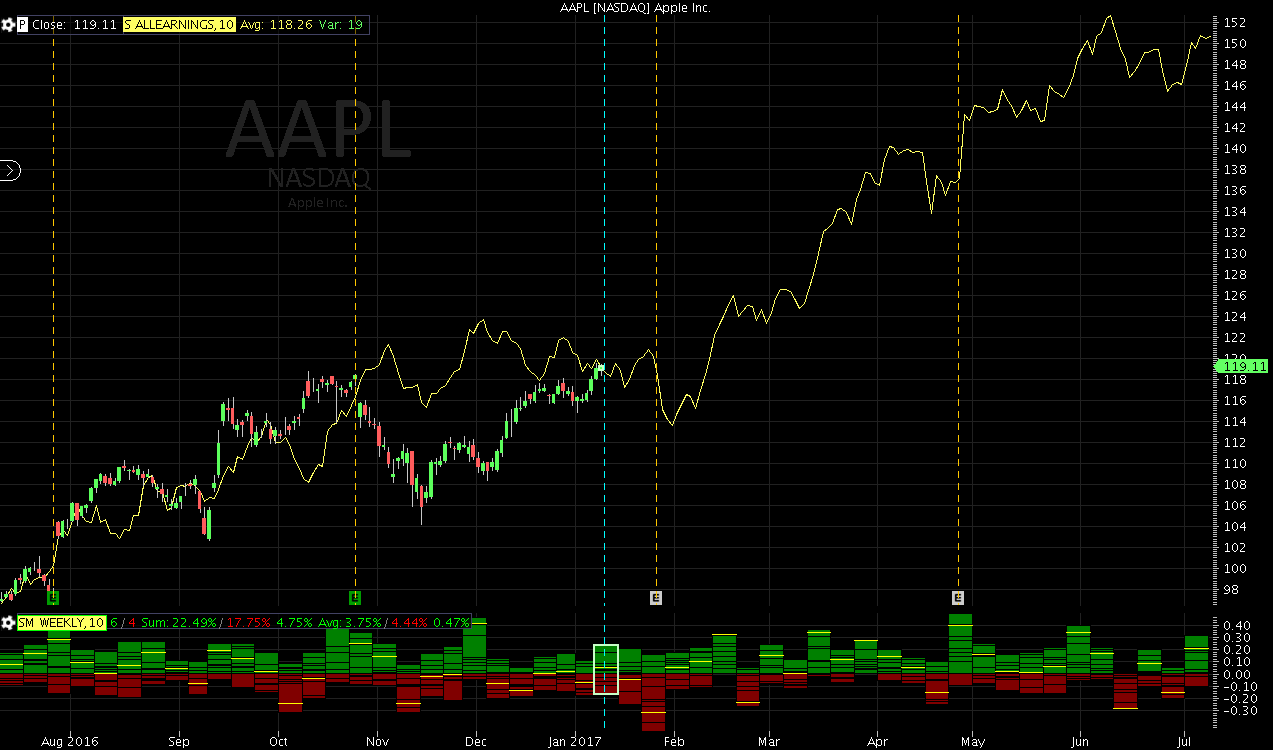
Simplifying the expected price movement data as much as we did presents a hazard. The sheer volume of data behind it gets lost in the shuffle.
So we innovated to create the Seasonality Momentum indicator that shows every datapoint in one easy to understand bar graph.
You can see all the detail for upto 30 years behind every price movement quarterly, monthly, weekly or every single day. The detail for daily price movements is a boon for Earnings traders.
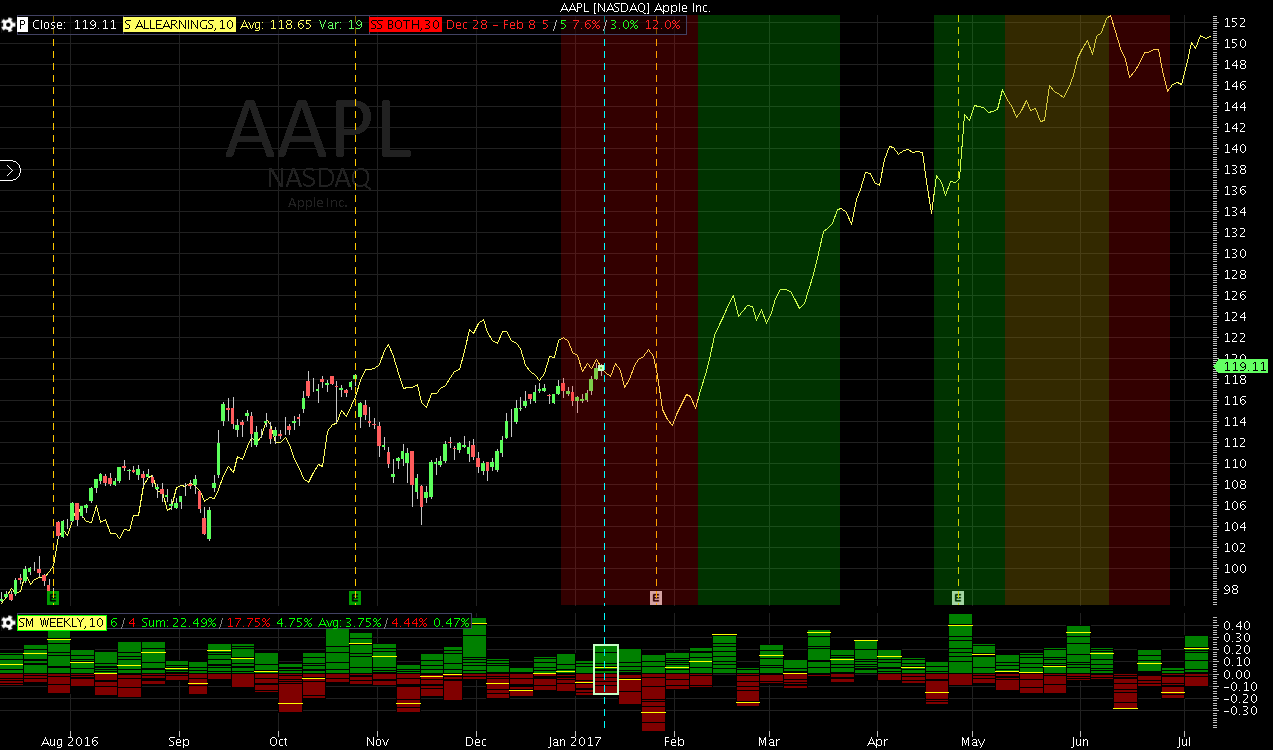
We isolate and quantify the best trading periods predicted by Seasonality for both long and short trades by maximizing the expected return on investment.
Then once again we avoid the hazard of oversimplifying, by showing the actual price movements over the corresponding trade periods going back up to 30 years and calculating a win percentage for all the actual cycles that made up the prediction.
These trade periods are the building blocks of a comprehensive strategy for using Seasonality to drive your trading.
So far we have shown a lot of annual Seasonality.
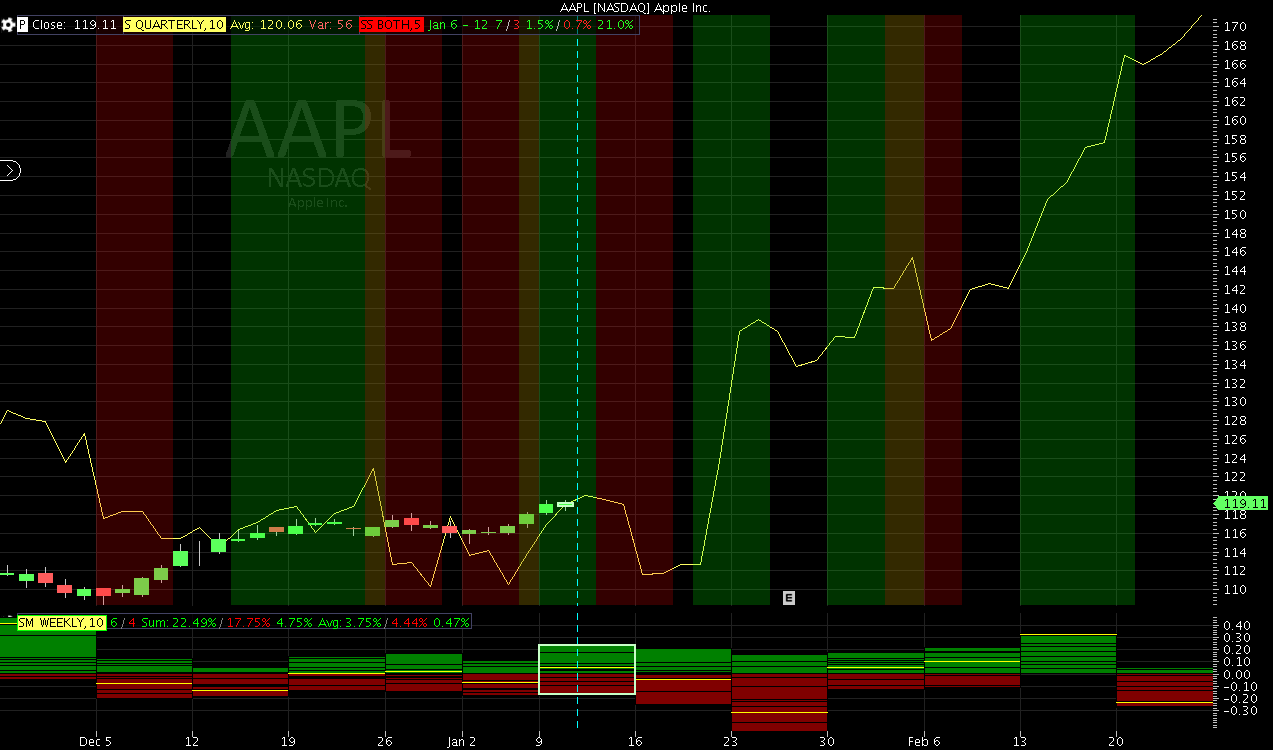
But we also have Quarterly Seasonality predicting price movements on a quarter over quarter basis.
With Monthly Seasonality you can see the same thing month over month.
Finally with Quarterly Earnings Seasonality you can line up all the earnings days for every quarter going back up to 30 years.
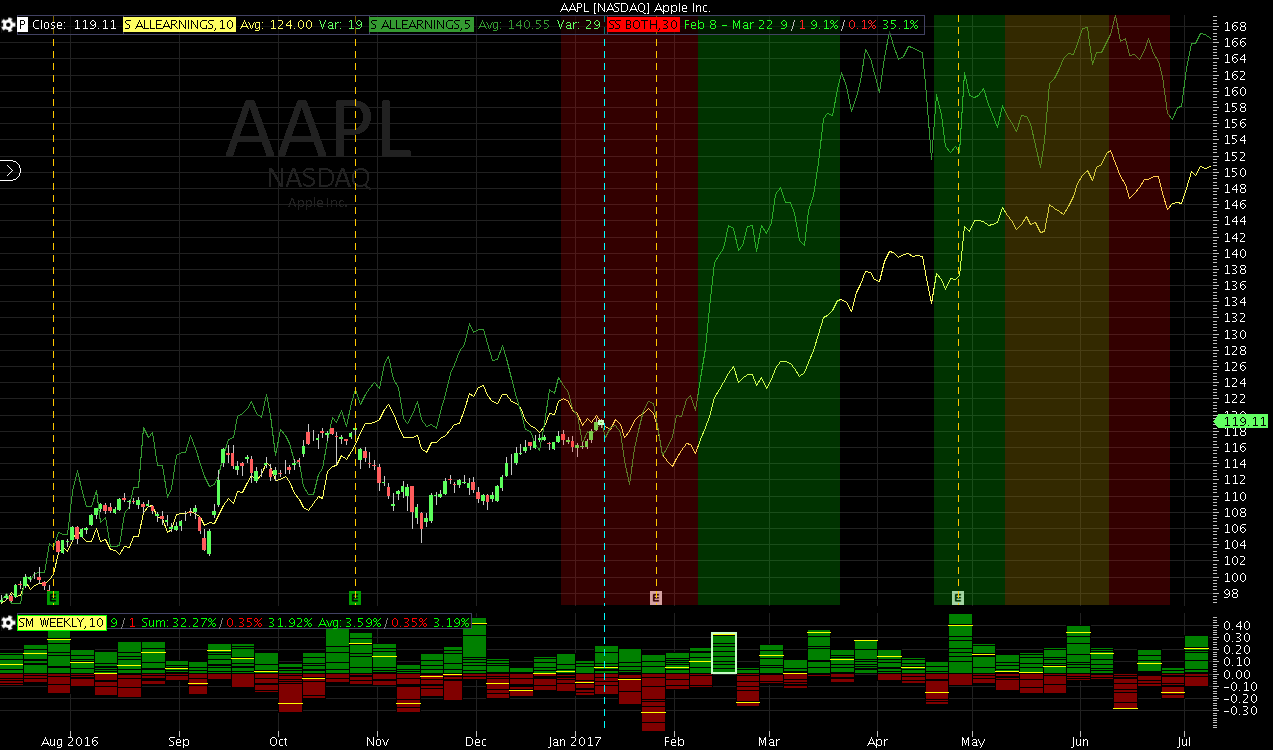
As a rule of thumb we determine our best trading periods using 10 year seasonality. Ten years typically picks up the clearest patterns without being affected by adding more noise from times where things were quite different.
However we like to mix in 5 year seasonality to confirm the price movements of the 10 year seasonality.
Sometimes we add 15, 20 or 30 year seasonalities to make us even more sure.
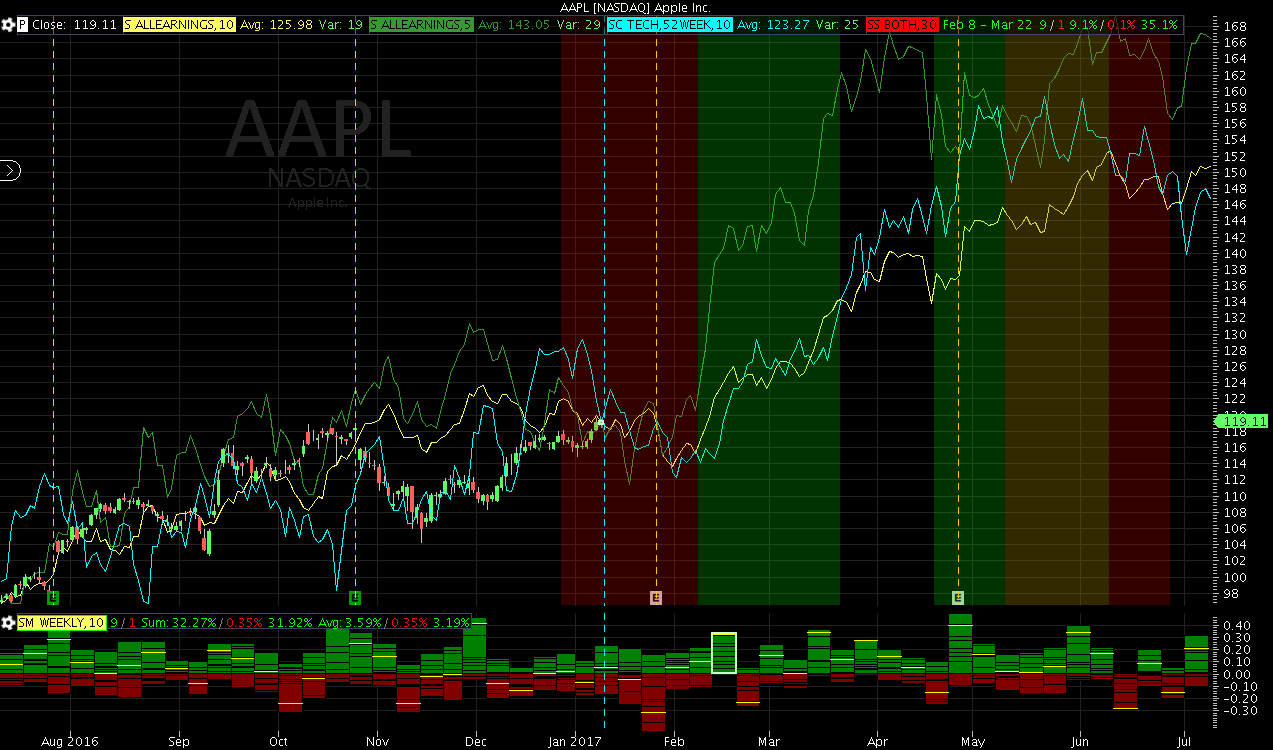
To further build a case we can compare our predicted trade periods with Seasonalities from other Stocks, Options, FOREX, Indexes, or Sectors.
Overlaying other Seasonalities is always a couple clicks away or can be automatically added with our advanced chart styles.
Nothing builds confidence more than seeing that the trade you are about to pick matches with the expected price movements of the Sector as whole.
At any time we can select each of the different cycles that made up the Seasonality that we are looking at.
This enlightens us by revealing all the individual price movements that made up the Seasonal price movements and highlights in order which cycles have performed most closely to the current cycle.
This can be the final confirmation from our tools Arsenal that we are making the best trade possible.
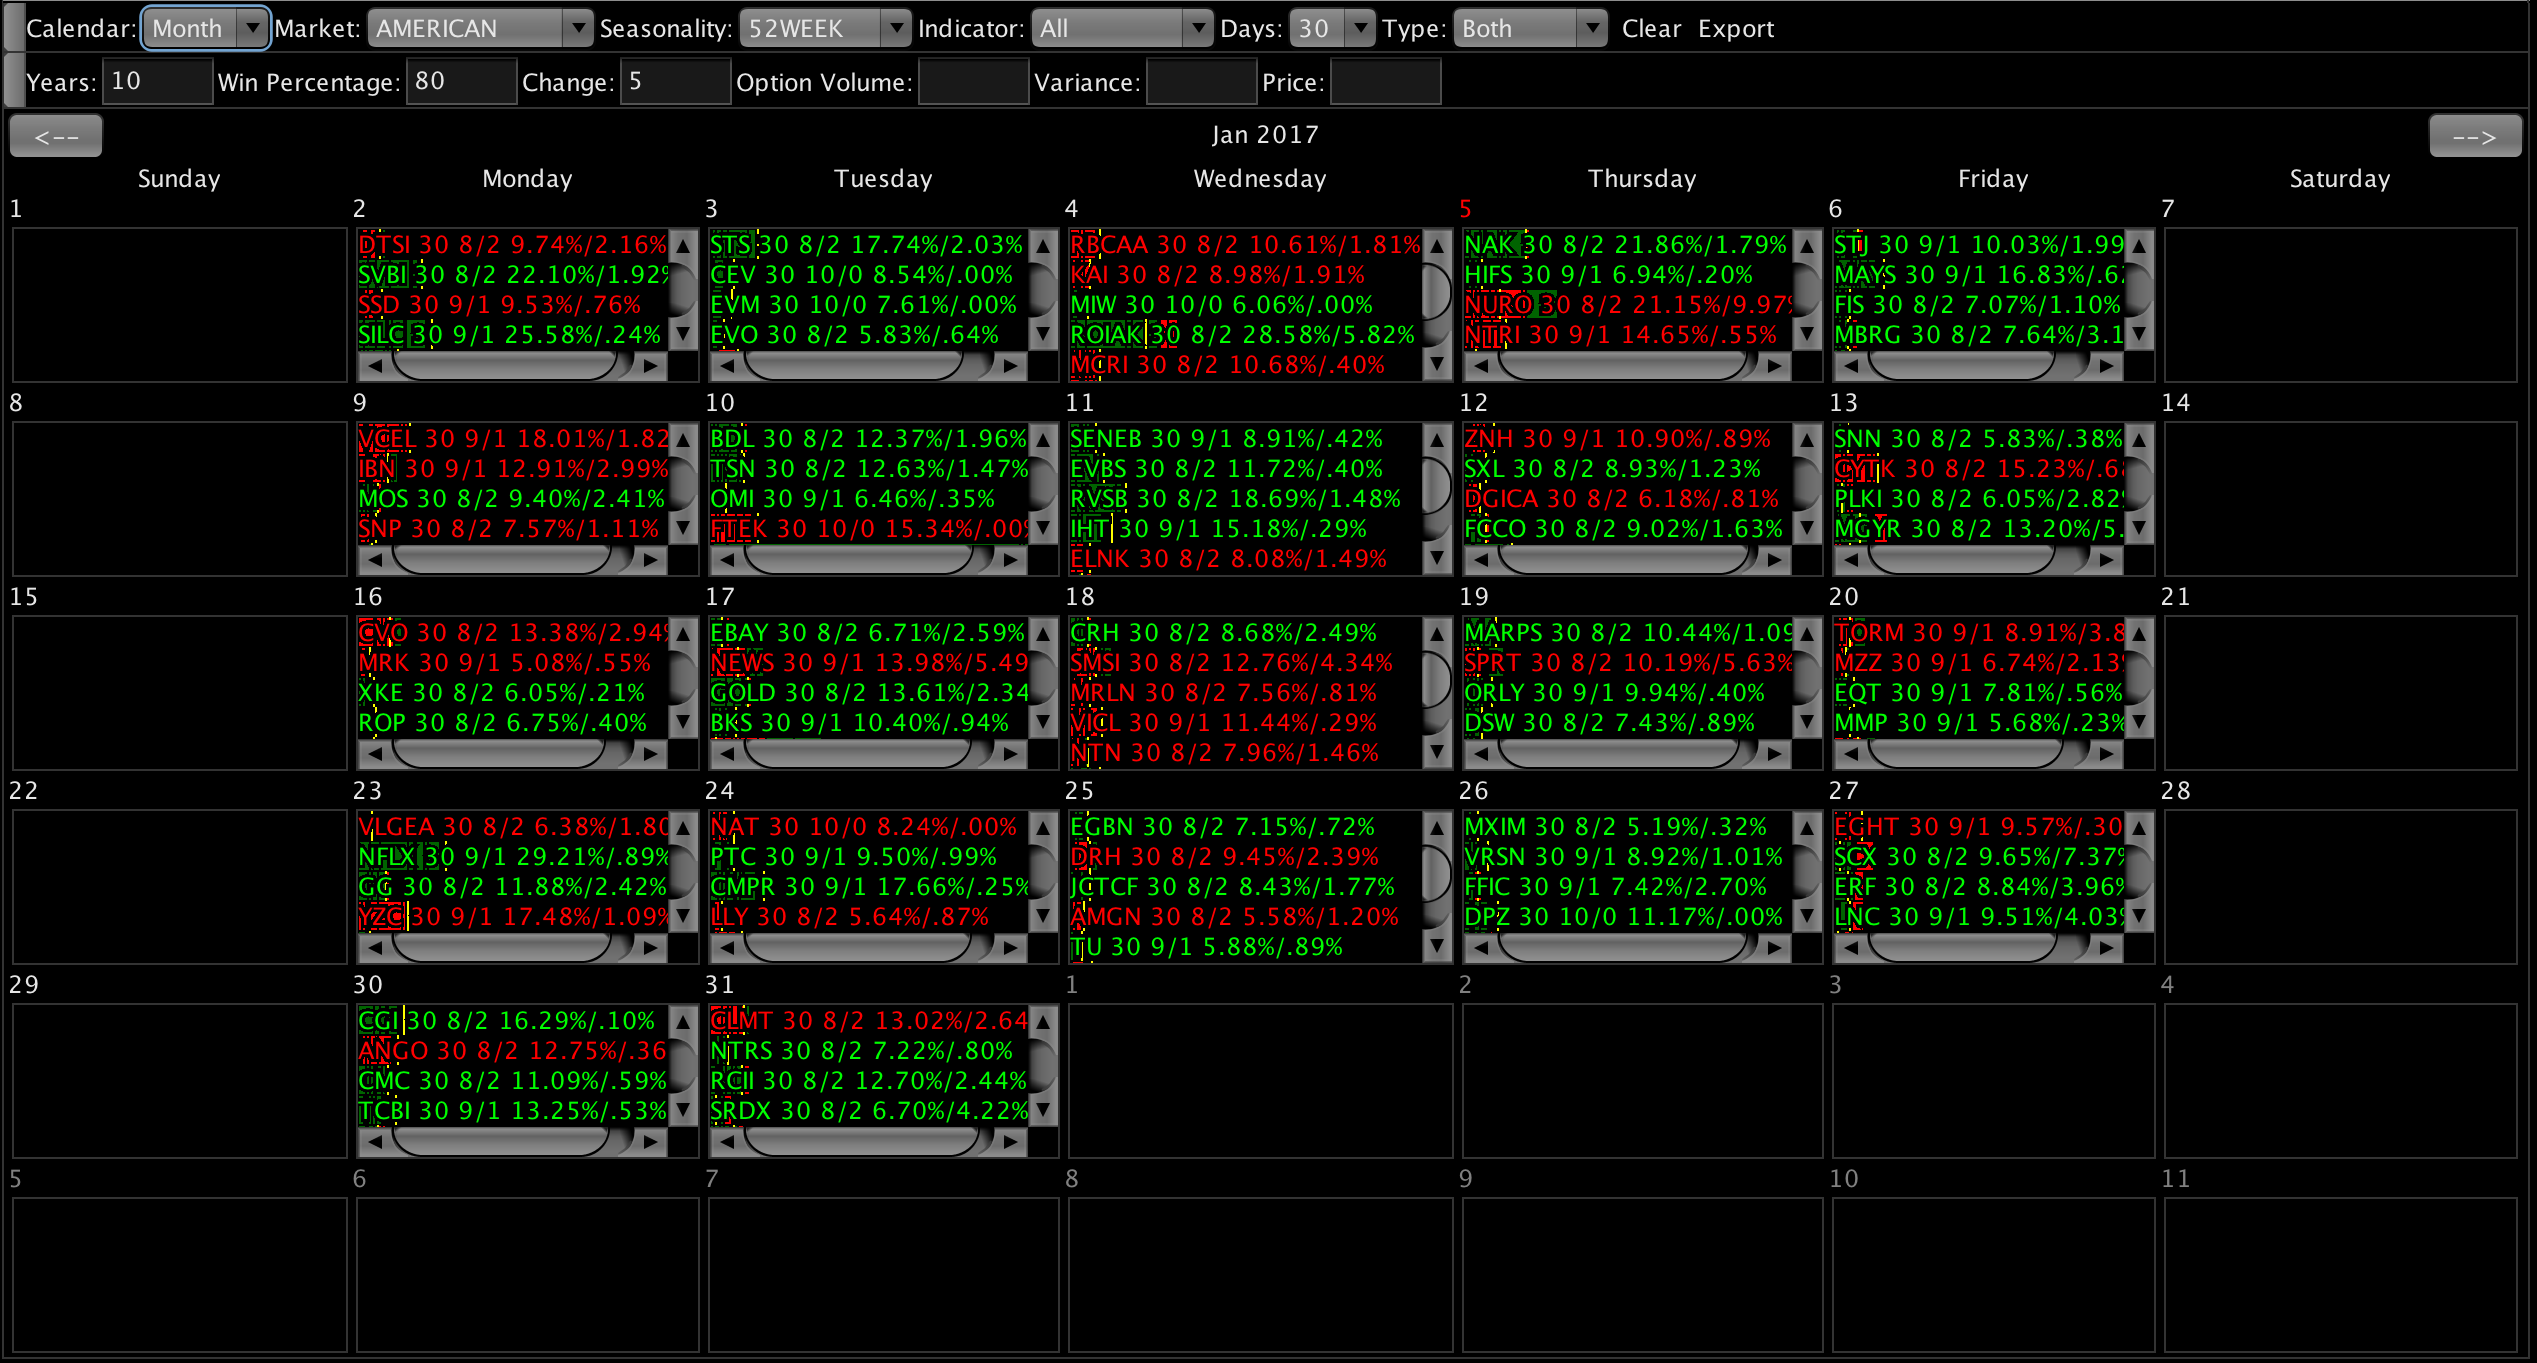
Leveraging the best trade periods calculated for over 10,000 stocks, commodities, sectors, indexes and FOREX we have created a trading calendar.
The calendar shows the best trades in a given week or month and can be narrowed down using various criteria and filters.
Calendar lays out the best trade periods based on when they start or the earnings date they depend on.
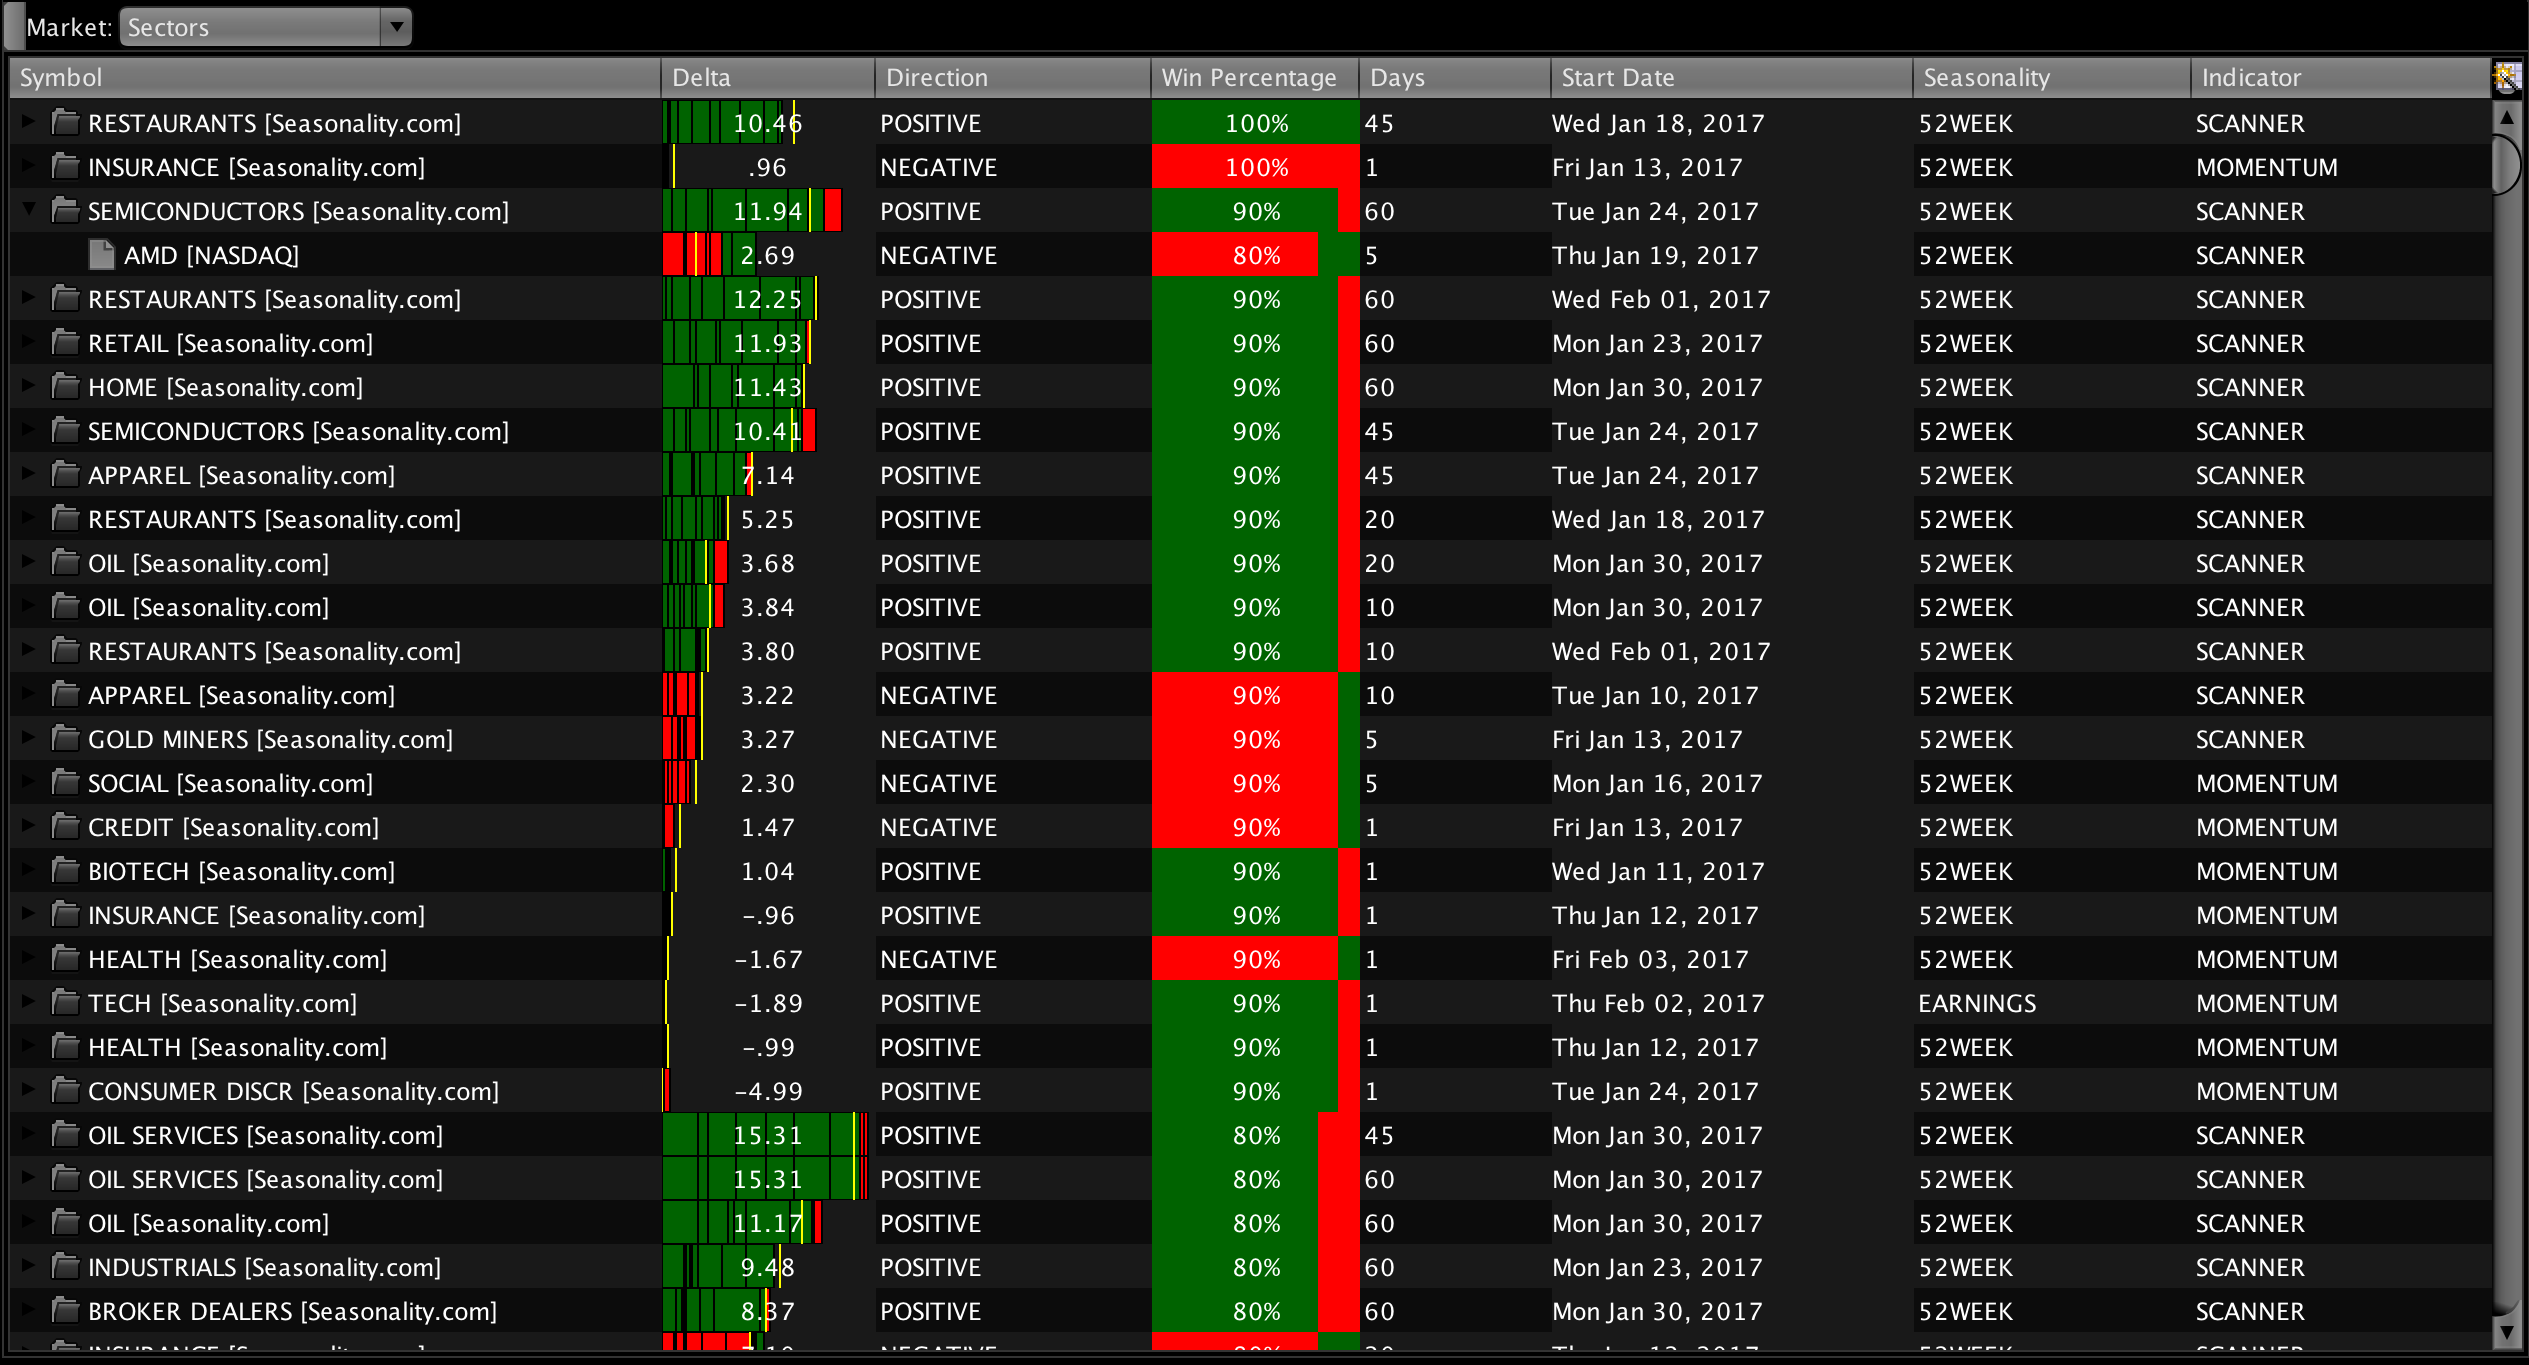
But Radar shows all upcoming trades, lets you compare and rank them, and can be narrowed down by various criteria and filters.
Radar also lets you find and compare at related trades in a click. For example, simply click to find all the trade options for the stocks in a sector, or the FOREX pairs related to another FOREX pair.
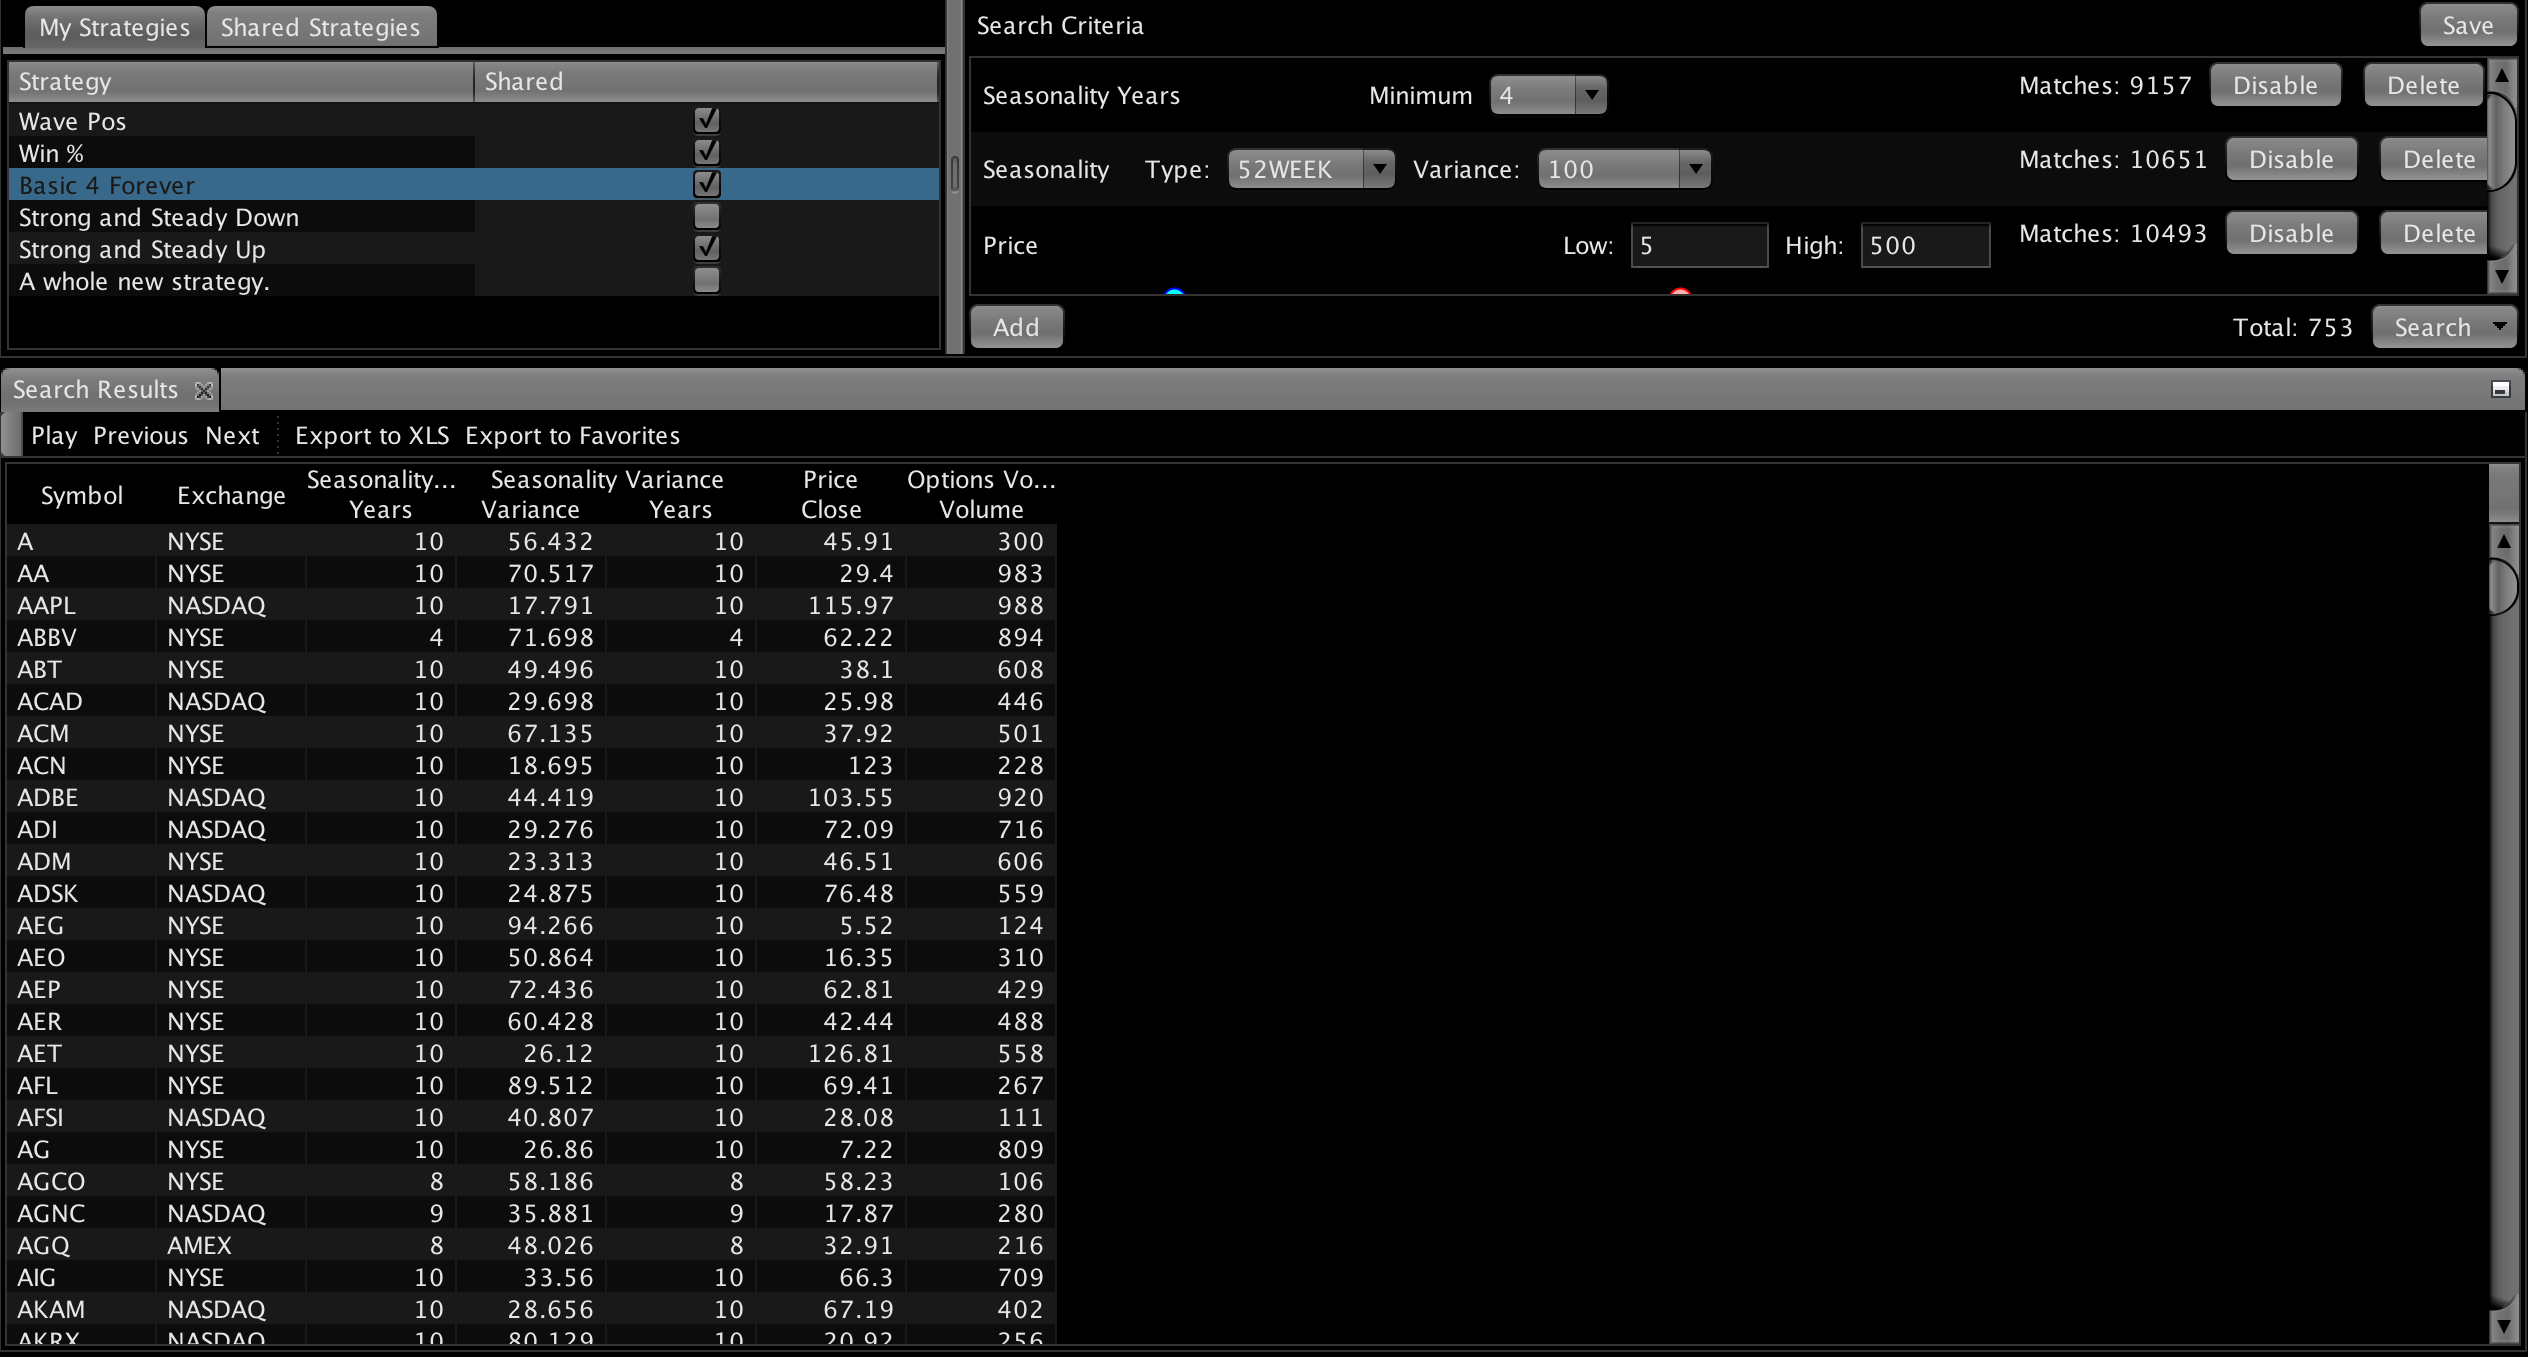
In case that wasn't enough, maybe we want to search for trades matching a zillion other criteria.
With an ever expanding library of search criteria you can search for MACD crossovers, Pocket Pivots, and many more.
You can save your criteria and settings into strategies and even share them with others.
And if we like some of these criterias and settings and want to apply them to the results shown by the Calendar or Radar...
We can do that too!

To join the Seasonality Trader family please use the subscribe button above.
For more information contact info@seasonalitytrader.com